## 参考サイト
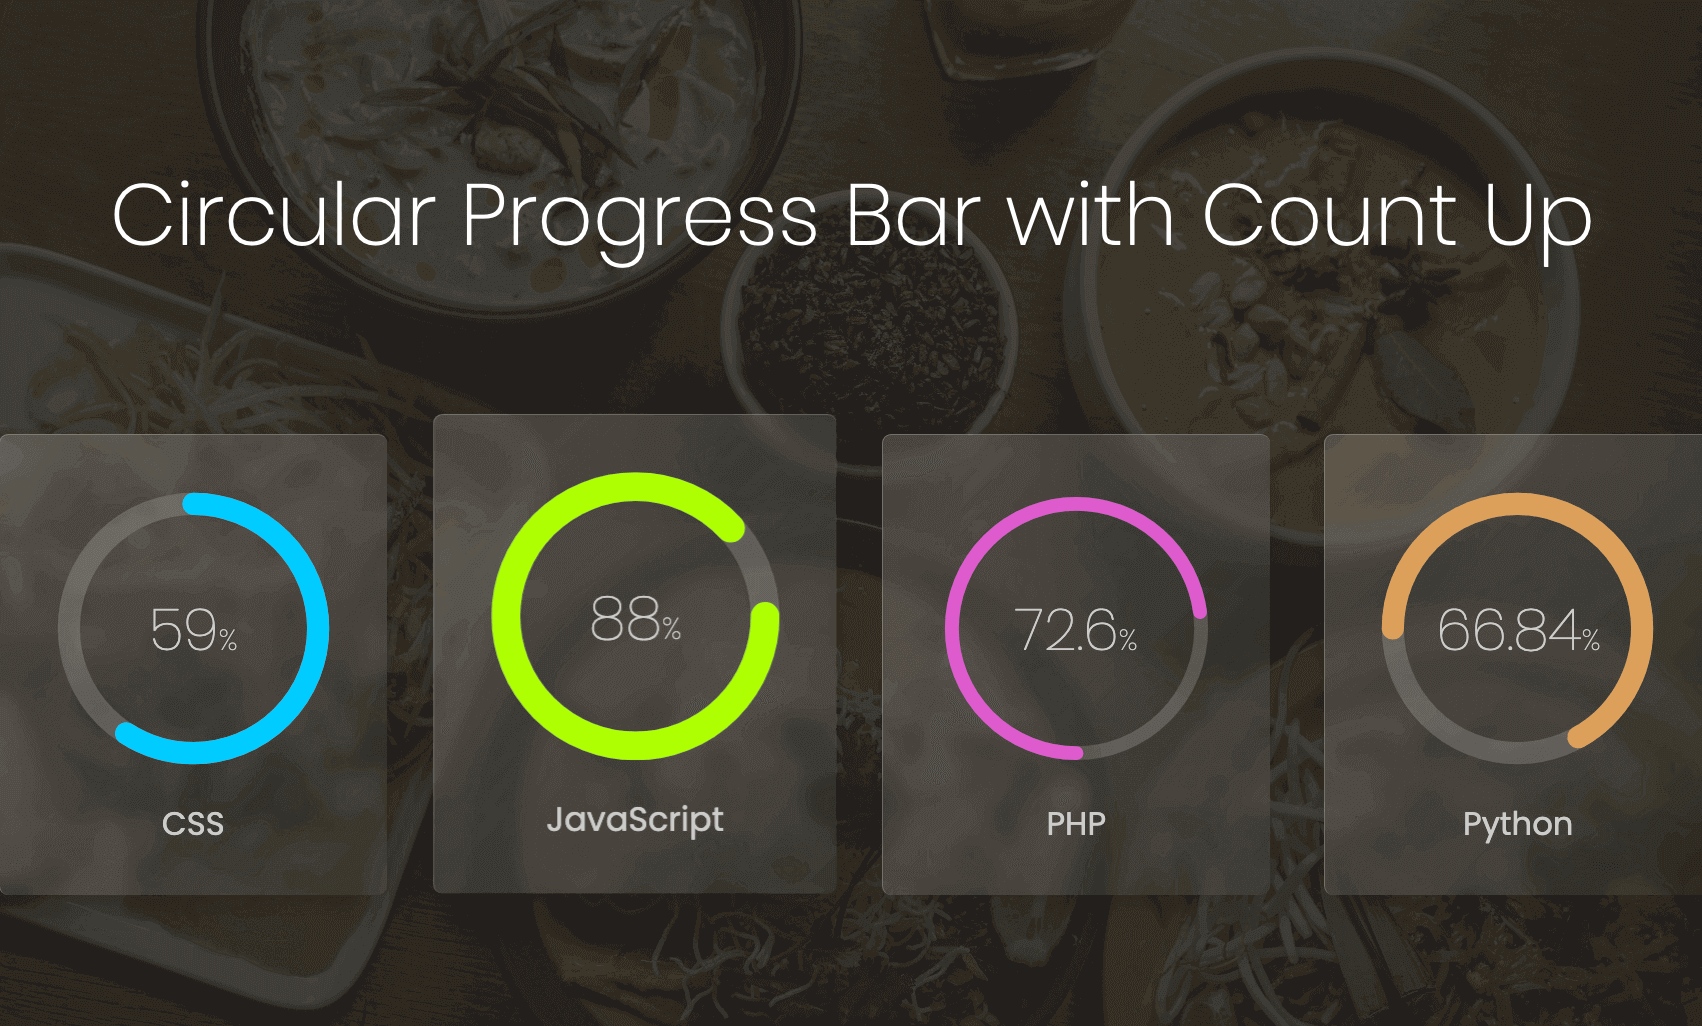
カウントアップも同時に表示する円形プログレスバーの表示デモ
今回は、Webページ上にサービスレベルやスキル、実績、状況などあらゆる物事についての度合いや進捗状況を表すための汎用性を考慮した円形グラフ(プログレスバー)を HTML(svg)、CSS、少量の JavaScript で表示するサンプルをご紹介します。 スクロールしてプログレスバーの要素が可視領域に入ったら、指定割合までプログレスバーとパーセンテージのカウンター数値が指定した秒数でアニメーションしながら表示されます。 まずは今回作成する円形プログレスバーのデモをご覧ください。 デモ See the Pen Animated Circular Progress Bar by digistate ...

## 方針
参考サイトのように SVG を使って実装します。
Vue を利用することで、SVG のプロパティである stroke-dashoffset をリアクティブに扱い、スクロールイベントに応じてその値を更新しようという考えです。
## 実装
<circle> の半径を とするとき、その円周の長さ (circumference)は、
で計算されます。これに対し、 だけ進んだ時のプログレスバーの弧の長さ (progress)は、
で計算できます。 を progressPercent というステートとして宣言し、 は computed フックを用いることで の値の更新を拾って勝手に再計算されるようにしています。
は JS の Window API および Document API を使ってスクロール量および画面高さを取得1して計算します。
Vue
<script setup lang="ts">
import { onMounted, computed, ref } from "vue";

// Progress circle
const radius = 42;

const progressPercent = ref<number>(0);

const circumference = 2 * Math.PI * radius;

const progress = computed<number>(() => {
  const val = 2 * Math.PI * (1 - progressPercent.value) * radius;
  if (progressPercent.value > 1) {
    return 0;
  }
  return val;
});

onMounted(() => {
  progressPercent.value = window.scrollY / document.body.scrollHeight;
  const height = document.body.scrollHeight;
  window.addEventListener("scroll", () => {
    const scrollAmount = window.scrollY;
    progressPercent.value = scrollAmount / height;
  });
})
</script>

<template>
  <div class="progress-wrapper">
    <svg class="progress-bar" viewBox="0 0 100 100">
      <circle class="bar" cx="50" cy="50" :r="radius"></circle>
      <circle class="bg" cx="50" cy="50" :r="radius"></circle>
    </svg>
  </div>
</template>

<style scoped lang="scss">
  .progress-wrapper {
    width: 42px;
    height: 42px;

    .bg {
      stroke: #ffffff;
      fill: #ffffff;
    }

    .bar {
      stroke-linecap: butt;
      stroke-width: 16px;
      stroke: $rose;   // #fb7185
      stroke-dasharray: v-bind(circumference);
      stroke-dashoffset: v-bind(progress);
    }
  }
</style>
#### 脚注
-
これらの API を使った処理はマウント後に行います。よって、処理の内容は
onMountedフックのコールバックに含めます。 ↩
記事がありません